

Customer satisfaction is the single clearest predictor of whether a customer comes back, pays more next time, or tells someone else to try you. It is not a soft metric sitting next to marketing spend. It is a growth lever with a direct line to retention, referrals, and revenue.
The evidence backs this up hard. PwC’s Australian customer sentiment research found that around 69% of customers would consider switching providers after one bad experience, while strong service noticeably lifts the odds of repurchase. Meanwhile, Symbos’ State of CX report puts satisfaction and repurchase intent at roughly 70% influence on future buying behaviour. Poor experiences, according to Qualtrics analysis summarised by ConvenienceWorldMag, cost Australian businesses up to $66 billion in lost sales, with 41% of Australians saying they will cut or stop spending after a bad interaction.
What does a healthy satisfaction score actually buy a business? Four things, consistently:
- Lower churn — satisfied customers stay longer and cost less to keep than new ones cost to acquire.
- Higher lifetime value — repeat buyers spend more per visit and tolerate price increases better than new prospects.
- Stronger referral rates — word of mouth from a satisfied customer is cheaper and more trusted than any ad.
- Reduced support costs — fewer complaints and escalations mean a leaner service operation.
Quick stat: PwC found that trust and service quality sit at the centre of whether a customer stays or leaves, with the majority of switching decisions traceable to a single poor experience rather than a slow accumulation of gripes.
Key Takeaways
Customer satisfaction functions as a growth lever because it directly shapes retention, referral behaviour, and the lifetime value a business extracts from every customer relationship.
| Point | Details |
|---|---|
| Satisfaction predicts revenue | High satisfaction correlates with stronger repurchase rates and referral volume, both cheaper than new acquisition. |
| Measure with the right tool | Use CSAT for transactions, NPS for loyalty, and CES for effort, rather than relying on one metric alone. |
| Start with transactional data | Businesses new to measurement should begin with CSAT before adding NPS or CES. |
| Fix process before adding delight | HBR’s research shows reliable resolution beats expensive delight spending on core metrics. |
| Don’t confuse repeat business with loyalty | Cross-check repeat purchases against advocacy signals before assuming a customer is genuinely satisfied. |
| Follow the 30/90/180 sequence | Audit first, build tooling and ownership second, then embed satisfaction data into cross-functional decisions. |
Table of Contents
- What is the role of customer satisfaction, and how does it differ from customer experience?
- Why does customer satisfaction matter for growth and loyalty?
- How do you measure customer satisfaction effectively?
- What are the most effective ways to improve customer satisfaction?
- How does customer satisfaction translate into measurable ROI?
- What mistakes undermine customer satisfaction programs?
- How do you build a 30/90/180-day customer satisfaction framework?
- A leadership view on prioritising satisfaction now
- Ready to put reliable service into practice?
- Sources
What is the role of customer satisfaction, and how does it differ from customer experience?
Customer satisfaction measures whether a specific interaction or transaction met expectations. It is a snapshot, not a running total. Customer experience (CX), by contrast, is the cumulative impression built across every touchpoint, from the first ad a customer sees to the tenth support call they make years later.
Treating the two as interchangeable is where a lot of measurement programs go wrong. Satisfaction tells you how one moment landed. CX tells you how the relationship feels overall. You need both, but you measure them differently and act on them on different timelines.
Here’s how the core concepts split apart:
- CSAT (Customer Satisfaction Score) measures a single transaction or moment, usually with a one to five scale.
- NPS (Net Promoter Score) measures overall loyalty and willingness to recommend, asked less often, usually quarterly.
- CES (Customer Effort Score) measures how hard the customer had to work to get their problem solved.
Typical moments to trigger a satisfaction check include right after a purchase, immediately following a support ticket closure, on delivery of a product or service, and at the end of an onboarding sequence. A software company might fire a CSAT survey the moment a support ticket closes. A retailer might send one two days after delivery. A subscription service might check in thirty days after a customer signs up, when the novelty has worn off and the real verdict starts to form.
Why does customer satisfaction matter for growth and loyalty?
Satisfaction is the first domino in a chain that ends in revenue. A satisfied customer sticks around longer, increasing lifetime value. A customer with high lifetime value refers others, which lowers your acquisition cost. Each link in that chain has been measured independently, and the direction is always the same.

Symbos’ research shows satisfaction and repurchase behaviour scoring near 70% influence on purchasing decisions in the Australian market, which means the relationship isn’t marginal, it’s foundational. Business Insider’s coverage of PwC’s executive commentary frames this bluntly: trust is now a survival currency, and satisfaction is how that trust gets earned or lost, transaction by transaction.
The commercial benefits stack up across several fronts:
- Revenue resilience — satisfied customer bases weather price rises and competitor promotions better than dissatisfied ones.
- Pricing power — customers who trust a brand’s quality are less price-sensitive at the margin.
- Free advocacy — referrals from satisfied customers convert at higher rates than paid leads, without the media spend.
- Reduced switching risk — every satisfied transaction lowers the odds a customer starts shopping around.
Statistic to remember: Forbes has reported that companies with high customer satisfaction scores frequently outperform financial expectations, tying the metric directly to the numbers a board actually cares about.
There’s also a widening gap worth watching. Symbos’ longitudinal analysis shows customer expectations in Australia have risen steadily over the past decade, while delivery hasn’t kept pace. Standing still on satisfaction, in other words, is functionally the same as falling behind.
How do you measure customer satisfaction effectively?
You need more than one number. CSAT tells you how a single moment went. NPS tells you whether the relationship as a whole is healthy. CES tells you whether you’re making customers work too hard to get what they need. Layer operational KPIs like churn rate, repeat purchase rate, and first-contact resolution on top, and you get a picture that’s actually actionable.
| Metric | Best use case | Sample survey question | Calculation / interpretation | Recommended cadence |
|---|---|---|---|---|
| CSAT | Transactional feedback (post-purchase, post-support) | “How satisfied were you with this interaction?” (1–5 scale) | % of 4–5 responses out of total responses | After every key transaction |
| NPS | Overall loyalty and advocacy | “How likely are you to recommend us to a friend?” (0–10 scale) | % Promoters (9–10) minus % Detractors (0–6) | Quarterly or biannually |
| CES | Effort required to resolve an issue | “How easy was it to resolve your issue?” (1–7 scale) | Average score; lower effort correlates with higher loyalty | After support interactions |
| Churn rate | Retention health over time | N/A (behavioural, not survey-based) | Customers lost ÷ total customers at period start | Monthly or quarterly |
| First-contact resolution | Support efficiency and effort reduction | N/A (operational metric) | Issues resolved on first contact ÷ total issues | Weekly or monthly |
Tools like Zendesk and Survicate are widely used to run these surveys and route the results to the right team automatically, which matters more than the survey question itself once volume grows. Zendesk’s own guidance frames the process as three steps: measure consistently, close the loop with the customer, and follow through operationally on what you learn.
Pro Tip:Sample size and timing matter more than most teams assume. A CSAT score built on twenty responses from your most engaged customers will lie to you. Aim for a consistent response rate across the full customer base, and stagger survey timing so you’re not always catching people in the same mood (a survey sent the moment a refund is approved will read very differently to one sent a week later).
One practical note on running these surveys online: if you’re collecting feedback through a website form or pop-up, check your cookie consent and privacy settings are configured properly before you launch, particularly if you’re capturing any identifiable customer data alongside the score.
What are the most effective ways to improve customer satisfaction?
Improvement splits cleanly into three timeframes, and confusing them is a common mistake. Quick wins buy you breathing room. Mid-term changes fix the systems that caused the problem. Long-term work redesigns the product or service so the problem stops recurring altogether.
- Quick wins (weeks): Cut response times on your busiest support channel; give frontline staff pre-approved scripts for the five most common complaints; add a same-day acknowledgement to every enquiry, even before it’s resolved.
- Mid-term (one to two quarters): Retrain staff on the specific failure points your CSAT comments keep flagging; fix the handoff points between departments where customers repeat themselves; build a standard process for escalating unresolved issues within 24 hours.
- Long-term (six months plus): Redesign the parts of your product or service journey that generate the most complaints; build satisfaction checkpoints into the product roadmap itself, not just the support desk.
A few things to keep in mind as you work through that list:
- Multichannel support matters less than consistent support. A customer who gets a fast answer by chat but a slow one by phone will remember the slow one.
- Personalisation earns real credit, but only when it’s accurate. A wrong name or a repeated question undoes more goodwill than generic service ever loses.
- Speed of resolution beats speed of first response. Acknowledging fast and then going quiet is worse for satisfaction scores than a slightly slower but complete resolution.
Realistic expectations matter here too. Quick wins move CSAT scores within weeks. Structural fixes, the kind that shift NPS or reduce churn meaningfully, tend to take one or two full quarters to show in the numbers, because they require the customer to experience the change, not just hear about it.
How does customer satisfaction translate into measurable ROI?
The link from satisfaction to revenue isn’t abstract, it’s arithmetic. Reduce churn by even a small margin, and the retained revenue compounds because those customers keep buying and referring others.
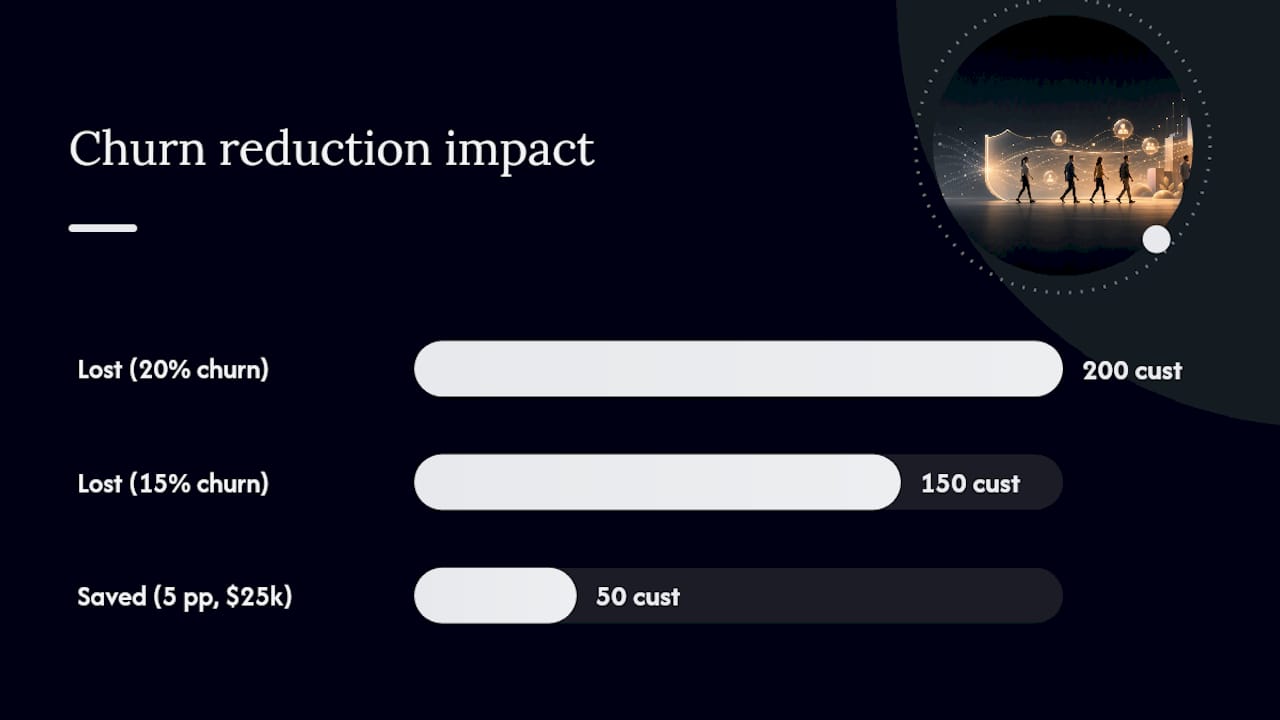
Here’s a worked example using round numbers to keep it clear. Say a business has 1,000 customers, an average annual value of $500 per customer, and a churn rate of 20% (meaning 200 customers leave each year). If a satisfaction improvement program cuts churn to 15%, that’s 50 fewer customers lost, worth $25,000 in retained annual revenue in year one alone. Factor in that retained customers tend to spend more over multiple years, and the real lifetime value protected is considerably higher than the single-year figure suggests.
Benchmarks help you set realistic targets rather than guessing. The ACSI tracks satisfaction scores across sectors in the US market and is a useful reference point for what “good” looks like by industry, even for readers outside that market, since relative gaps between sectors tend to hold up globally.
| Data point | Figure | Source |
|---|---|---|
| Customers likely to switch after one bad experience | ~69% | PwC Australia |
| Influence of satisfaction/repurchase on buying behaviour | ~70% | Symbos State of CX |
| Estimated cost of poor CX to Australian businesses | Up to $66 billion | Qualtrics via ConvenienceWorldMag |
| Australians who’d cut spending after a bad experience | 41% | Qualtrics via ConvenienceWorldMag |
Statistic worth flagging: Forbes has noted that companies posting strong satisfaction scores tend to beat analyst expectations on financial results, which is about as direct a link to shareholder value as a “soft” metric gets.
What mistakes undermine customer satisfaction programs?
Most satisfaction programs don’t fail because the metric is wrong. They fail because of how the metric gets collected, interpreted, or acted on.
- Infrequent sampling. Surveying once a quarter on a handful of transactions gives you a number, but not a trend. Fix it by automating a survey trigger on every key transaction, even if you only analyse the results monthly.
- Small sample sizes. A CSAT score from twenty responses out of ten thousand transactions is statistical noise dressed up as insight. Fix it by tracking response rate alongside the score itself, and flag any period where response volume drops.
- Ignoring qualitative feedback. A number tells you something happened. A comment tells you why. Fix it by tagging open-text responses by theme, even manually at first, so recurring issues surface before they show up in the score.
- Assuming returning customers are loyal. Repeat business is sometimes just inertia or a lack of alternatives, not genuine satisfaction. Fix it by cross-checking repeat purchase data against advocacy signals like NPS or referral rates before calling a customer “loyal.”
Pro Tip:HBR’s research found that expensive attempts to “delight” customers rarely move the metrics that matter, while simply meeting expectations reliably does. Before you fund a surprise gesture or loyalty gimmick, check whether the underlying process, response time, first-contact resolution, accuracy, is actually solid first. Delight spending on top of a broken process is money wasted twice.
How do you build a 30/90/180-day customer satisfaction framework?
A satisfaction program doesn’t need a year-long rollout to start showing results. It needs a sequence: audit first, build the system second, embed it into the business third.
- Days 1–30 (audit and quick wins): Map every current touchpoint where you could measure satisfaction. Fix the two or three response-time or communication gaps your team already knows about. Launch a basic CSAT survey on your highest-volume transaction type.
- Days 31–90 (process and tooling): Stand up a proper survey tool such as Zendesk or Survicate across all key channels. Assign clear ownership of each metric to a specific role, not a committee. Build a simple weekly dashboard that tracks trend lines, not just snapshots.
- Days 91–180 (scale and embed): Extend measurement to NPS and CES on top of transactional CSAT. Feed satisfaction data into cross-functional reviews with product, operations, and sales, not just support. Tie at least one performance incentive to a satisfaction or resolution metric.
A workable dashboard at the 180-day mark should track five things: CSAT trend (owned by support leadership), NPS trend (owned by marketing or customer success), churn rate (owned by finance or revenue operations), first-contact resolution (owned by support operations), and average response time (owned by the frontline team lead). None of those metrics matter in isolation. They matter because product, operations, support, and sales are all looking at the same numbers and adjusting accordingly. Consistent service delivery, the kind that shows up in this dashboard month over month, is exactly what businesses like Isaac’s Pro Detailing build into their own operating rhythm, because a mobile service lives or dies on whether the same quality shows up at every job, not just the first one.
A leadership view on prioritising satisfaction now
Customer satisfaction gets treated as a support-team metric in too many businesses, tracked quietly in a dashboard nobody outside the service function opens. That’s a mistake worth correcting at board level, not just at team level. The data is unambiguous: satisfaction predicts repurchase, repurchase predicts revenue, and the businesses that treat this chain seriously outperform the ones that don’t.
The practical starting point isn’t complicated. Pick one metric, run it consistently for ninety days, and act on what it tells you before adding a second metric. Most programs collapse not from lack of data but from collecting too much of it and acting on none. The 30/90/180 framework above works precisely because it forces sequencing.
Isaac’s Pro Detailing has built its entire service model around this same principle applied to mobile car care: consistency of outcome, delivered at the customer’s own location, matters more than any single grand gesture. That’s the same discipline any business chasing genuine satisfaction gains needs to apply, whether the product is a detailed car or a delivered software feature.
Ready to put reliable service into practice?
If you’re a Sunshine Coast vehicle owner reading this and wondering what consistent, satisfaction-driven service actually looks like in practice, it starts with a provider who treats every job the same way regardless of postcode or time of day. Isaac’s Pro Detailing runs on exactly the operational discipline this article describes: measured outcomes, closed feedback loops, and a mobile workflow built to deliver the same result whether you’re at home, at work, or parked at the beach. Check the wash menu for pricing on interior extraction, cut and polish, or ceramic coating, and see how a properly run detailing service applies the same principles covered above to your own vehicle.